The 2025 Temperature Check Europe report provides a data-led overview of carbon emissions across the European events sector, using one of the largest aggregated datasets available for business events. By analysing high-quality TRACE data from approximately 1000 events across multiple countries, it establishes a clearer picture of how emissions are distributed across event activities and formats.
The report highlights the sector’s main carbon hotspots, ongoing improvements in measurement practice, and the need for reliable baselines to guide effective reduction strategies. These baselines set the groundwork for going deeper – breaking emissions down by event type and event size – so organisations can understand how their events compare with the wider landscape and make informed, confident decisions.
How different event types influence carbon emissions
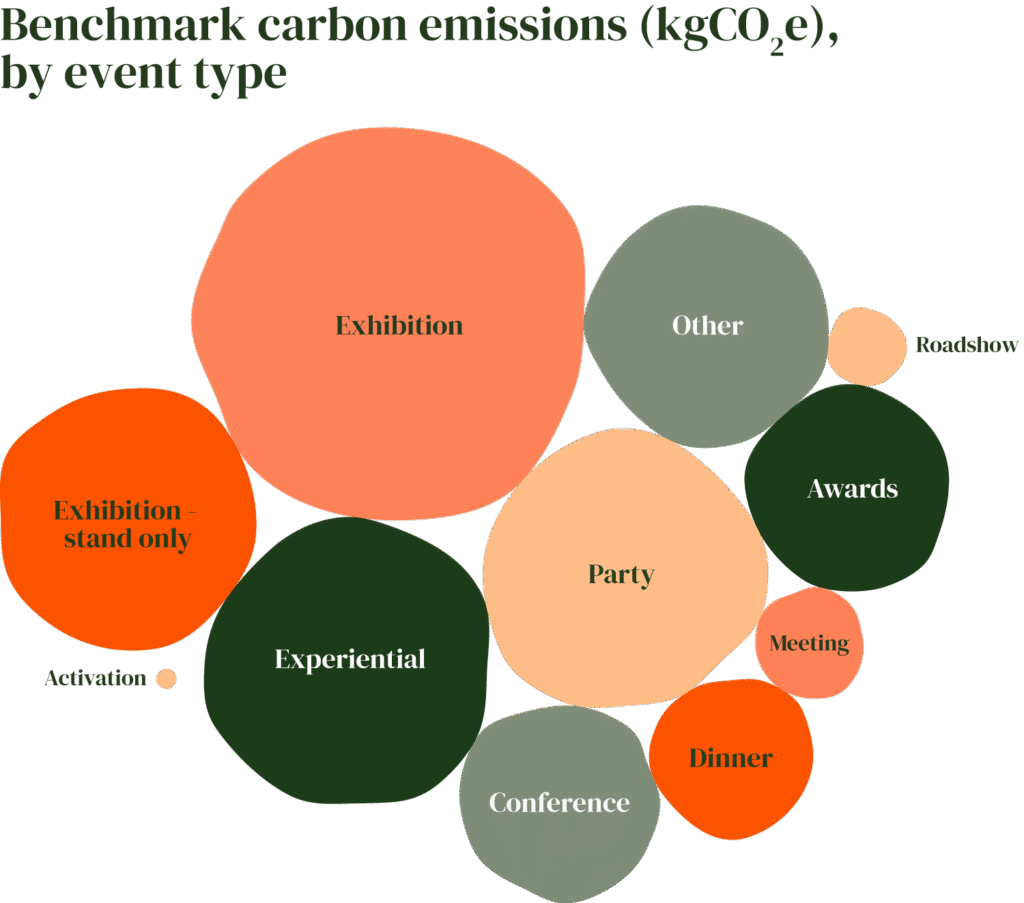
Event formats vary widely in their carbon profiles. High-production environments such as exhibitions or experiential builds tend to sit at the upper end of the carbon scale. Meetings, activations and dinners typically fall much lower. Understanding this variation helps planners benchmark their event’s carbon footprint accurately and identify where changes will have the greatest impact.
Using TRACE data, we’ve visualised median emissions (kgCO₂e) by event type as relative-sized bubbles, a clear way to see how categories compare at a glance.
These visuals give teams practical benchmarking context by showing:
- Typical emission ranges for common event types
- How materials, production, and travel influence different formats
- Where an event sits relative to industry norms
- Which levers are most likely to deliver reductions
For those who need deeper detail, including quartiles and the amount of variability, the full event-type benchmarks are available to download here.
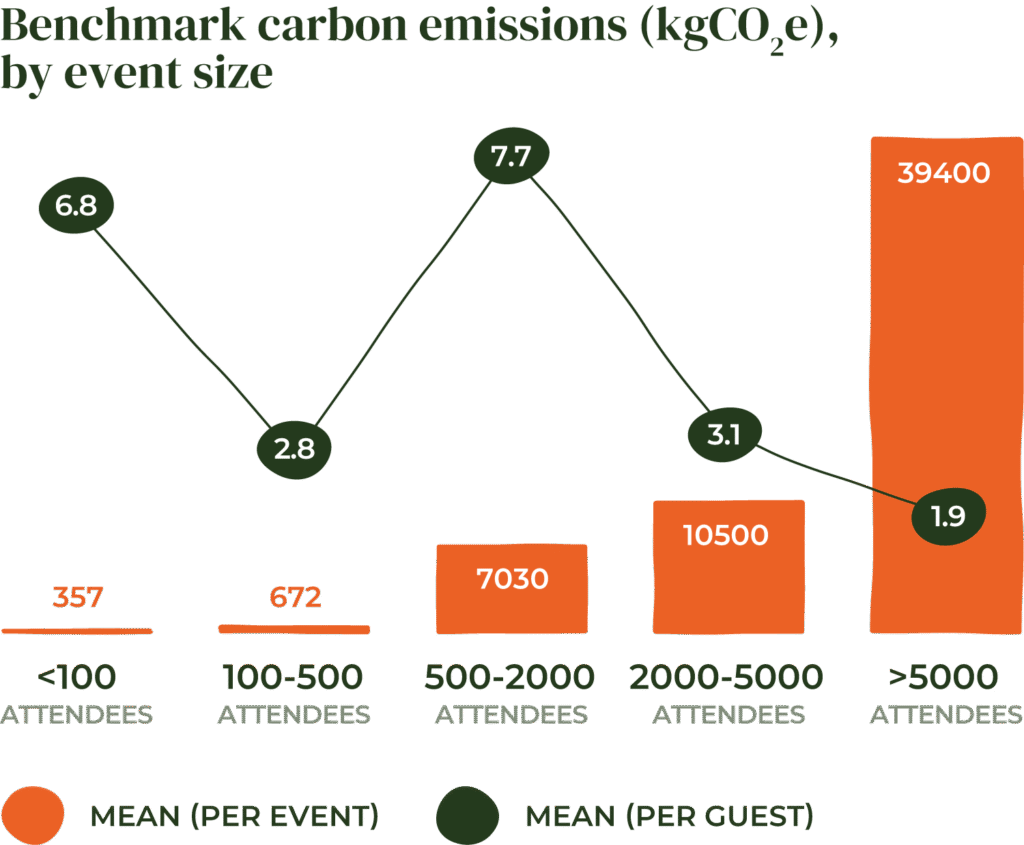
Why event size changes the picture
Event size is another major factor shaping event carbon emissions. Larger events do generate more total emissions, but the relationship with emissions intensity is different. When measured as kgCO₂e per attendee, many larger events show greater efficiency compared to smaller ones. This reflects the value of consolidated logistics, more efficient venue energy use, and economies of scale in production.
Event size influences:
- Travel demand and distance
- Catering volume and menu choices
- Venue energy usage
- Material and build requirements
Even within the same type of event, emissions profiles shift significantly as the audience grows. This is why size-based benchmarks matter: they help teams understand both the absolute footprint of an event and its per-attendee emissions intensity.
Actions that consistently support lower emissions at any scale include:
- Designing production to reduce material use and increase reuse
- Optimising energy loads and collaborating with venues
- Managing food waste and selecting lower-impact menus
- Encouraging lower-carbon travel behaviour
- Embedding measurement early at the planning stage to inform decisions, supporting improved data quality and comparability post event
The full size-based benchmark tables are also available to download here.
Why event carbon benchmarking matters
Good benchmarking gives teams a credible frame of reference to assess their performance and identify where meaningful reductions can be achieved.
By combining baselines from the 2025 Temperature Check Europe report dataset with deeper breakdowns by type and size, organisations gain a much clearer view of:
- What ‘typical’ looks like for their kind of event
- Where their own footprint sits in relation to the wider industry
- Which categories and behaviours drive emissions
- Where to prioritise effort to make progress
When measurement is consistent and grounded in activity-based data, the result is simple: more confident decisions and more effective climate action.
A note on using these benchmarks responsibly
These benchmarks are a helpful guide, but they’re only as strong as the data behind them. While the dataset is one of the most comprehensive available, measurement across the sector is still uneven, with gaps in boundaries, activity data and reporting consistency. This means benchmarks should be seen as a reference point, not a replacement for your own measurement.
The most meaningful comparison will always come from tracking your events over time. Building your own dataset is what enables true progress, giving you clarity on where emissions are coming from and where reductions will have the greatest impact for your events. The sooner measurement becomes part of your regular workflow, the sooner your benchmarks become more accurate and actionable and the sooner you can be celebrating your progress.
If you need help getting credible event carbon insights you can act on with confidence, try out a free Demo of TRACE by isla.