For production teams, sustainability has always been part of delivery. Power, logistics, materials and build decisions shape how events function in the real world, long before any reporting happens.
Carbon measurement, however, has often been pulled together after the event, sometimes using assumptions that don’t fully reflect what actually took place on site. That gap is closing.
As expectations around carbon data increase, production activity is becoming central to whether event reporting is credible or not. This is because the decisions made during production determine the quality of the event data everyone else relies on.
Production data already exists
Across the event lifecycle, production is one of the few areas where tangible, observable activity data already exists as part of day-to-day working.
Fuel use, power supply, transport distances, equipment loads, materials installed and removed are all elements production teams plan and manage as standard. They are also inputs required for credible carbon measurement.
This is why activity-based approaches to carbon measurement consistently outperform cost-based estimates, particularly in production contexts. Spend rarely maps cleanly to emissions. Activity almost always does.
When production data is captured at source, sustainability teams are no longer forced to rely on proxies. Instead, they can work with information that reflects what actually happened and why.
What production-led data is already showing
When production activity is measured with enough detail, clearer emissions patterns start to emerge.
Power, technical infrastructure, freight and materials regularly account for a significant share of an event’s footprint. Just as importantly, these are areas where data confidence can be higher, because the information already exists.
This creates a clear opportunity. Production is one of the most practical places to improve the reliability of event carbon data.
How expectations are shifting for production partners
Production teams are increasingly being asked to explain what they delivered and how they delivered it.
Questions about power sources, fuel use, generator run-time, grid connections and transport decisions are becoming more common. These conversations reflect a wider shift across the industry: production decisions now sit directly upstream of carbon reporting.
This shift is already visible among specialist production partners, particularly those supplying power and technical infrastructure, where clients are looking for clearer explanations of the carbon implications of different delivery choices.
For production teams, this is less about taking on a reporting role and more about making existing decisions visible.
From delivery choices to useful insight
One of the most common weaknesses in event reporting is that production activity is captured at too high a level.
When detail is missing, sustainability teams fall back on averages. When detail is available, production data becomes one of the most informative parts of the footprint.
Factory42’s, The Green Planet project puts this into practice. By capturing specific information on production power, materials and technical delivery, the project moved beyond broad assumptions and towards a clearer understanding of where emissions actually sit.
The value was the ability to explain why that figure looked the way it did and what could realistically be done differently next time.
That distinction is what turns measurement into insight.
Why better production data benefits the whole supply chain
Clear, consistent production data supports sustainability reporting and improves decision making across the event supply chain.
It helps organisers understand trade-offs between cost, logistics and impact. It supports venues in aligning infrastructure with real usage patterns. And it allows suppliers to demonstrate preparedness as expectations increase.
It also reduces risk. As environmental claims and procurement requirements become more rigorous, vague or heavily estimated production data becomes harder to stand behind.
Activity-based production data allows teams to say:
- This is what we used
- This is how it was powered
- This is what we know and where the limits are
That clarity builds trust between teams who depend on each other’s information.
What production teams are and aren’t being asked to do
It’s worth being clear about what this shift does not mean.
Production teams are not being asked to own sustainability strategy, produce corporate emissions reports, or guarantee perfect data.
What is changing is the expectation that production activity can be recorded, understood and explained.
In practice, that often looks like:
- Capturing fuel and energy use where possible
- Recording transport distances and loads
- Documenting material choices and reuse
- Sharing data early, rather than retrospectively
Production as part of event readiness
As carbon data becomes part of how events are evaluated, production teams play a quiet but critical role in organisational readiness.
The projects and suppliers that stand out are the ones that can explain their decisions clearly, acknowledge limits honestly, and improve consistency over time.
For an industry built on precision and execution, this shift is an extension of the professionalism production teams already bring to event delivery.
For teams that want to explore this further, isla’s Event Carbon Measurement Starter Pack and TRACE case studies provide practical guidance and real-world examples.
Sustainability leads in businesses that run events are being held to higher scrutiny than ever before when it comes to their organisation’s emissions data. They’re expected to know what the numbers are and how confident the organisation is in them.
It’s part of the territory that events are internally and publicly scrutinised, which is why it’s extra important within this industry that an organisation’s sustainability data is as strong as possible.
For sustainability leads in businesses that run events who are finding this mission challenging, it is not a failure of intent or capability, but a reflection of the structural reality of how events are delivered and where current measurement practices still fall short.
As scrutiny increases, it’s important that we’re honest about where event data typically breaks down, and what credible progress really looks like in practice.
Events sit where data confidence is lowest
Insights from the Temperature Check Reports show a clear pattern: the areas with the highest emissions are often not the areas with the strongest data confidence.
Across industry datasets captured through TRACE:
- Staff travel and accommodation data was completed in around 88% of measured events, making it one of the most consistently reported data areas.
- Production transport data was recorded in approximately 75% of events, again with relatively low reliance on estimates.
- In contrast, energy data was captured in only around 57% of events, and waste data even less consistently, despite both being known contributors to event emissions.
For sustainability leads, this creates a familiar challenge. An organisation may be measuring their events, but confidence varies sharply depending on the data type, particularly where primary data depends on venues or suppliers outside direct control.
Measurement effort does not equal measurement quality
Another key insight from industry data is that more measurement does not automatically mean better measurement.
Many organisations are already investing time in capturing event emissions, yet analysis shows:
- Some of the most frequently reported emissions rely heavily on estimated data
- Data is often captured inconsistently across events, even within the same organisation
- Different teams apply different assumptions, limiting comparability over time
Audience travel is a good example. While often discussed as a priority, early industry reporting indicates only around 43% of events recorded any audience travel data at all, and the low rate of audience travel data capture is still accurate as of 2025. Where it was captured, it frequently represented only a proportion of total journeys.
For sustainability leads, partial data can still be valuable, but only when its limitations are clearly understood and communicated.
What leading organisations are doing differently
Organisational insights highlighted in the Temperature Check Reports point to a noticeable shift among more mature organisations.
These organisations tend to:
- Prioritise data confidence over data completeness
Focusing first on areas where reliable activity data already exists.
- Embed measurement into event delivery processes
Making data capture part of standard workflows, not a post-event clean-up exercise.
- Standardise methods internally
Applying consistent boundaries and assumptions across all events, even where gaps remain.
This approach reduces rework, improves internal trust in the data, and makes it easier for sustainability leads to explain results, including uncertainty, with confidence.
Learning from where the gaps are
One of the most valuable outcomes of industry measurement has been visibility of where data is missing or unreliable.
For example:
- Waste volumes are often underreported, suggesting systemic reporting gaps rather than genuinely low waste generation.
- Energy data is frequently estimated, highlighting ongoing challenges in accessing venue-level consumption figures.
- Materials data, despite being heavily influenced by event design decisions, is inconsistently captured across event types.
For sustainability leads these gaps are signals, pointing to where internal processes, supplier engagement, or contractual data requirements need to evolve.
Reframing success for sustainability leads
As regulatory, assurance and stakeholder expectations grow, success is not defined by having a complete dataset.
It is increasingly defined by being able to say, with confidence:
- Which data is robust
- Where estimates have been used
- How consistently methods are applied
- And what is being done to improve quality over time
Industry reporting consistently shows that clarity builds trust, even when the picture is incomplete. Overstated certainty, by contrast, often creates more risk than transparency ever does.
Building progress without overclaiming
With time and due process, event data can become more consistent, more explainable and more useful.
For sustainability leads, progress often looks like:
- Fewer assumptions year on year
- Stronger internal alignment on boundaries
- Improved data quality in priority areas
- And a shared understanding of what ‘good enough for now’ actually means, at both an organisational and industry level
That is how event measurement matures, through repeatable, defensible practice.
For teams looking to strengthen how they approach event carbon measurement, the Event Carbon Measurement Starter Pack offers practical guidance on improving data quality, consistency and confidence.
By Anna Abdelnoor, CEO & Founder, isla & TRACE by isla
Imagine an accountant telling you it’s fine to just reconcile the books each month and there’s no need to actually look at the P&L 😳
The numbers balance, so what more do you need?
No analysis of margins, cost, cash… and no view of future exposure.
🙅🏻♀️ You’d fire them 🙅🏻♀️
Now imagine that same accountant saying they can help you, but only by comparing your accounts to other companies they work with.
Not how you performed last quarter, not whether you’re improving or getting worse, not what’s changing over time inside your business.
Just a benchmark that tells you how you stack up against someone else.
🙅🏻♀️ You’d fire them twice 🙅🏻♀️
If you’ve got a sustainability provider telling you that they offer more value than “just” emissions reporting because they offer you benchmarks about how you’re performing against others, or that they can help you demonstrate your sustainability creds – they’re completely missing the point.
It would be like that same accountant telling you how you’re performing without actually reconciling your books 🤭🙃
Consistent, comparable emissions data is as foundational to business continuity planning as your financial accounts.
Without either, you cannot forecast, mitigate, adapt, diversify, invest, reorganise or thrive.
No-one in their right mind would try to run a business without understanding trends in their revenue, costs, liabilities and cashflow, and emissions data feeds the insights around that information.
👉 It exposes where your supply chain is fragile
👉 It reveals where cost, carbon and risk concentrate
👉 It tells you where to put time, energy and money
👉 and just as importantly, WHERE YOU DO NOT NEED TO.
Comparing your performance – emissions or financial – to another business doesn’t help you understand what you’re already doing well, and it doesn’t gives you a baseline to forecast what you need to do differently as the operating environment shifts.
And the operating environment ✨is✨ shifting.
Geoeconomic shocks, geopolitical instability, regulatory change and resource constraints are already shaping margins, operations and impacting business continuity.
And it’s showing up in your accounts already – it’s just misattributed to rising costs, when the root cause of rising costs is ecological debt.
Benchmarks don’t help you plan for and solve the problems coming down the track in your near-term business future, without solid emissions reporting underneath them.
If you can get your head around that and learn how emissions data feeds business continuity, then your CFO and clients will thank you for it when they realise you’re bringing them decision-grade information instead of another sustainability narrative.
If what you want is to say you’re “doing good”, we’re probably not the product for you.
But if you’re an events business that wants to understand how to ensure continuity through sustained volatility, TRACE by isla helps with that.
Event organisers and suppliers are being asked to compile and share more data than ever before, from emissions reports and supplier disclosures to sustainability credentials in client pitches.
When it comes to reporting event carbon data though, the difference between credibility and greenwashing comes down to one thing: transparency.
To be transparent, you must be providing clarity, showing what’s been measured, how it’s been measured, and what the results actually mean. When your data is transparent, others can trust it. And when they trust it, they act on it.
Transparency is the foundation of credible carbon insights
Credibility is built through data that’s clear, consistent, and traceable. TRACE defines credible carbon insights through four essential principles: accuracy, completeness, consistency, and comparability.
- Accuracy: Ground emissions in real activity data, rather than broad financial estimates: litres of fuel, kilowatt hours, kilograms of waste.
- Completeness: Capture the full picture. Leaving out indirect emissions hides key parts of your carbon footprint.
- Consistency: Apply the same standards and methods each time so your results are reliable and repeatable.
- Comparability: Measure progress fairly against your own history or industry benchmarks, using the same rules.
When event data reflects these pillars, it’s no longer just a compliance exercise, but a foundation for insight and progress. Stakeholders can trace the source of each figure, understand the context, and trust that reductions are genuine and not just accounting adjustments.
Why transparent carbon data is now non-negotiable
Measurement is an environmental commitment and now a business requirement.
Regulations such as the Corporate Sustainability Reporting Directive (CSRD) and the Green Claims Directive are reshaping how organisations disclose and validate their sustainability information. Companies must now provide verifiable evidence for their emissions data and environmental claims.
This regulatory shift affects the entire event supply chain, with larger businesses increasingly asking their event partners for measurable emissions data to complete their own reports. For agencies, venues and organisers, transparency is fast becoming a baseline expectation.
Data from the Temperature Check Report Europe 2025 illustrates this shift clearly:
- 38% of leading businesses are already measuring emissions, despite only 17% being legally obligated to report.
- Scope 3 reporting is expected to become the norm across Europe by 2030.
- Greenwashing crackdowns now carry penalties of up to 10% of annual turnover for unsupported environmental claims.
Without clear, traceable data, organisations risk non-compliance, reputational damage, and exclusion from client frameworks. With transparency, they can demonstrate accountability, anticipate change, and prove leadership through evidence rather than aspiration.
Turning transparency into competitive advantage
Transparent measurement should not be thought of as a burden, rather a strategic advantage.
Event professionals who can explain how their numbers came about build stronger relationships and make better-informed decisions. Transparent data helps you:
- Demonstrate credibility: Verifiable, traceable data makes your reductions tangible.
- Future-proof compliance: Activity-based measurement aligns with recognised standards, ready for audit.
- Strengthen partnerships: Clients and suppliers collaborate more effectively when everyone can see what’s working.
- Direct investment: Clarity on emission hotspots means resources go where they make the biggest difference.
Take catering as an example. Recording meal types and quantities with accuracy, instead of relying on cost-based estimates, can reveal actionable insights, such as plant based menus generating up to 90% fewer emissions than red meat (data from TRACE by isla). That kind of visibility turns data into informed choices that reduce both carbon and cost.
Using transparent event carbon data to make better decisions
True transparency depends on systems that make credible measurement achievable and repeatable. Clear, activity-based data delivers far more than a number on a spreadsheet, it highlights practical places to take action. Examples drawn from industry research include:
- Catering
The dataset in our Temperature Check Report Europe 2025 shows plant based meals produce up to 95% fewer emissions than red meat, and a full plant based swap in the recorded events would have saved 714 tCO₂e. That level of insight is only possible when meal types and quantities are accurately recorded.
- Production materials
Data shows that production materials can account for up to half of an event’s emissions, especially for exhibitions and conferences. Without material weights, composition, or reuse data, these hotspots remain invisible.
- Transport and logistics
The same data shows that production transport represents over 30% of emissions for some event types. Accurate distance and weight data highlight where consolidating deliveries or switching suppliers can cut emissions meaningfully.
- Energy use
Venues that measure actual energy consumption, rather than using standard estimates, support organisers to report event emissions more reliably.
These insights make decision-making clearer, more strategic and more grounded in real operational context.
Building trust through clarity
Transparent data meets compliance standards AND builds lasting credibility and confidence.
When clients and stakeholders can see the story behind your numbers, they know your progress is real. That trust strengthens relationships, encourages collaboration, and positions your organisation as a leader in responsible event delivery.
Transparency is how we bridge the gap between measurement and action, as well as intention and impact.
To strengthen your own reporting and communicate progress with confidence, download your Event Carbon Measurement Starter Pack,a practical guide to making your data credible, complete, and actionable. Or, if you’re not already measuring and you’re ready to get credible carbon insights you can act on with confidence, get your free demo of TRACE.
For busy event professionals ready to take sustainability seriously.
Sustainability now appears in most event RFPs. Current industry insight suggests that around 62% of RFPs include sustainability requirements, yet those requirements are often vague.
Questions like:
- Do you have a sustainability policy?
- Are you accredited?
- Do you meet our sustainability standards?
are increasingly common. But they don’t always translate into what event teams actually need in order to deliver an event, measure its impact, or meet client and stakeholder expectations.
Whilst an event supplier may be strong on sustainability at a company level, that doesn’t automatically mean
- You’ll have actionable emissions data for your event
- Measurement will align with reporting needs
- Information will be consistent and comparable across events or suppliers
- You’ll generate insights that support real design and procurement decisions
For event professionals, this creates a practical problem. Asking about sustainability capability is not the same as requesting the specific data and support your event requires.
This checklist is designed for teams who need to move from sustainability intent to consistent delivery and credible data, without adding unnecessary complexity to already busy workflows.
The 2025 Temperature Check Europe report provides a data-led overview of carbon emissions across the European events sector, using one of the largest aggregated datasets available for business events. By analysing high-quality TRACE data from approximately 1000 events across multiple countries, it establishes a clearer picture of how emissions are distributed across event activities and formats.
The report highlights the sector’s main carbon hotspots, ongoing improvements in measurement practice, and the need for reliable baselines to guide effective reduction strategies. These baselines set the groundwork for going deeper – breaking emissions down by event type and event size – so organisations can understand how their events compare with the wider landscape and make informed, confident decisions.
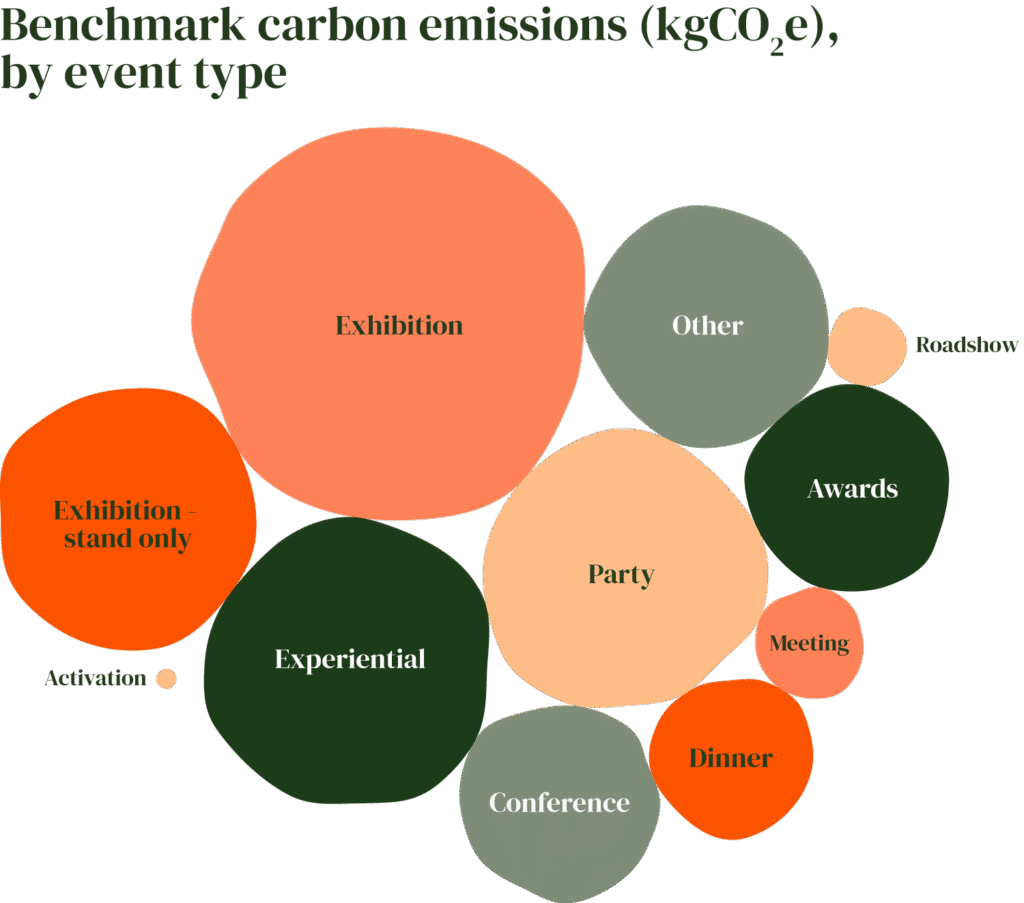
How different event types influence carbon emissions
Event formats vary widely in their carbon profiles. High-production environments such as exhibitions or experiential builds tend to sit at the upper end of the carbon scale. Meetings, activations and dinners typically fall much lower. Understanding this variation helps planners benchmark their event’s carbon footprint accurately and identify where changes will have the greatest impact.
Using TRACE data, we’ve visualised median emissions (kgCO₂e) by event type as relative-sized bubbles, a clear way to see how categories compare at a glance.
These visuals give teams practical benchmarking context by showing:
- Typical emission ranges for common event types
- How materials, production, and travel influence different formats
- Where an event sits relative to industry norms
- Which levers are most likely to deliver reductions
For those who need deeper detail, including quartiles and the amount of variability, the full event-type benchmarks are available to download here.
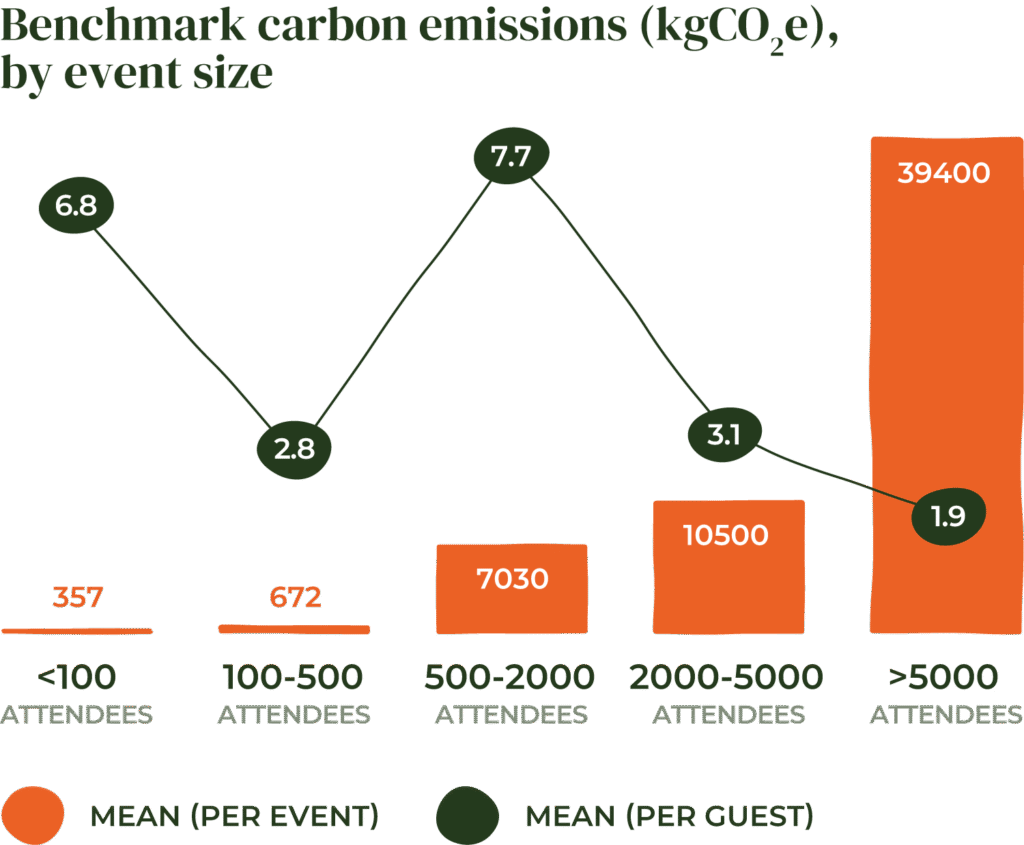
Why event size changes the picture
Event size is another major factor shaping event carbon emissions. Larger events do generate more total emissions, but the relationship with emissions intensity is different. When measured as kgCO₂e per attendee, many larger events show greater efficiency compared to smaller ones. This reflects the value of consolidated logistics, more efficient venue energy use, and economies of scale in production.
Event size influences:
- Travel demand and distance
- Catering volume and menu choices
- Venue energy usage
- Material and build requirements
Even within the same type of event, emissions profiles shift significantly as the audience grows. This is why size-based benchmarks matter: they help teams understand both the absolute footprint of an event and its per-attendee emissions intensity.
Actions that consistently support lower emissions at any scale include:
- Designing production to reduce material use and increase reuse
- Optimising energy loads and collaborating with venues
- Managing food waste and selecting lower-impact menus
- Encouraging lower-carbon travel behaviour
- Embedding measurement early at the planning stage to inform decisions, supporting improved data quality and comparability post event
The full size-based benchmark tables are also available to download here.
Why event carbon benchmarking matters
Good benchmarking gives teams a credible frame of reference to assess their performance and identify where meaningful reductions can be achieved.
By combining baselines from the 2025 Temperature Check Europe report dataset with deeper breakdowns by type and size, organisations gain a much clearer view of:
- What ‘typical’ looks like for their kind of event
- Where their own footprint sits in relation to the wider industry
- Which categories and behaviours drive emissions
- Where to prioritise effort to make progress
When measurement is consistent and grounded in activity-based data, the result is simple: more confident decisions and more effective climate action.
A note on using these benchmarks responsibly
These benchmarks are a helpful guide, but they’re only as strong as the data behind them. While the dataset is one of the most comprehensive available, measurement across the sector is still uneven, with gaps in boundaries, activity data and reporting consistency. This means benchmarks should be seen as a reference point, not a replacement for your own measurement.
The most meaningful comparison will always come from tracking your events over time. Building your own dataset is what enables true progress, giving you clarity on where emissions are coming from and where reductions will have the greatest impact for your events. The sooner measurement becomes part of your regular workflow, the sooner your benchmarks become more accurate and actionable and the sooner you can be celebrating your progress.
If you need help getting credible event carbon insights you can act on with confidence, try out a free Demo of TRACE by isla.